Interactive visualisation of the influences of philosophers
2021-02-19Last year, I started a data visualisation and aggregation project on my free time which I recently updated. Feel free to explore at cpauvert.shinyapps.io/in-phi-luence.
This project stemmed from a question of my partner regarding the schools of thoughts and influences of philosophers and next thing I knew I had opened R and had an excuse for a first Shiny application.
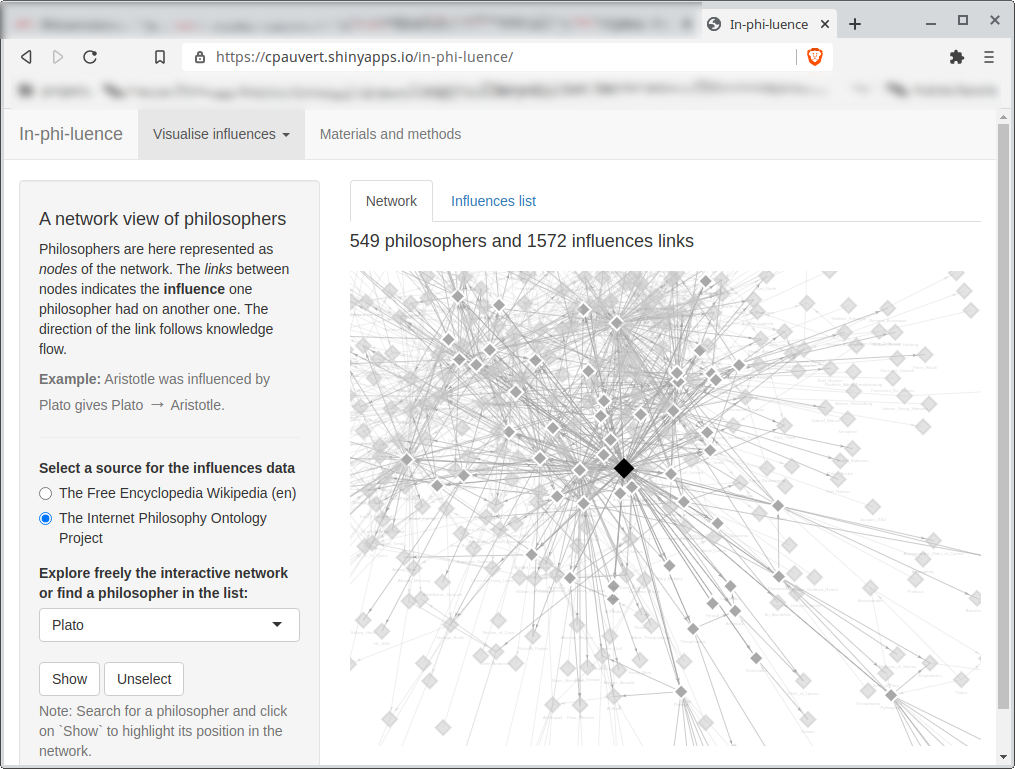
The screenshot just above illustrates the Shiny application in-phi-luence displaying an interactive network of philosophers. Initially the sole data source of philosophers influences was The Free Encyclopedia Wikipedia (en) whom articles on philosophers of science were automatically scraped (R code available on Github).
Few months after the initial draft version of the application, I stumble upon an interesting project, The Internet Philosophy Ontology Project (InPho) which is a scholarly resource that compiles ontologies on philosophers and which are then made accessible through API or OWL files. Using the latter, I was able to fetch and concatenate monthly archives of the InPho ontologies to build a network. The R and Python code, and a Snakemake workflow are available on Github.
Another awesome resource, The Standford Encyclopedia of Philosophy, could have been used for a curated source of influences. However it did not provide any API to access its data nor flat files databases.
In the future I plan to compare the two networks (Wikipedia vs. InPho) and perhaps suggest missing influences to Wikipedia. Another interesting lines would be the analysis of the philosophers network using node-level metrics. The in and out degrees are already displayed in a n interactive table but I unexpectedly struggle to find a relevant metrics (among centrality measures or authority scores) so far but there is room for improvements.